


Document Actions
gvSIG-Desktop 1.1. Manual de usuario.
Editor de leyendas
Introducción
This tool can be used to carry out theme mapping relatively easily.
To symbolise or represent the element data or variables in a layer, you can choose the most suitable colour, pattern, etc. for each one.
Go to the “Properties” menu (right click on the layer) to edit the legend symbol properties.
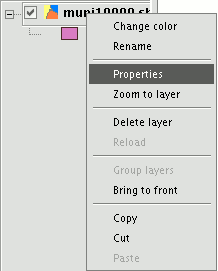
A new window appears. Click on the “Symbols” tab.
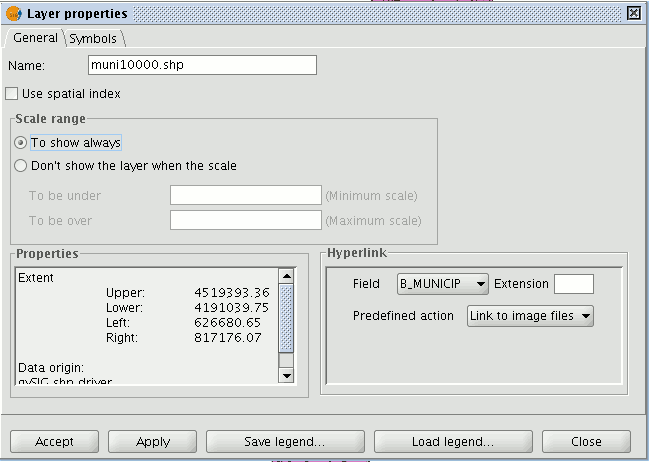
Use this tab to define the legend type you wish to use to represent the layer data more specifically.
You can choose between the following:
Unique symbols: This is gvSIG’s default legend type and represents all the elements of a layer using the same symbol. It is useful if you need to show the location of a layer over and above any of its other attributes.
Unique values: Each record can be represented by a unique symbol according to the value it has in a particular field in the table of attributes. It is the most effective method to show categorical data, such as towns, types of land, etc.
Intervals: This type of legend represents the layer elements using a range of colours. The intervals or graduated colours are mainly used to represent numerical data which increase progressively or have a range of values, such as population, temperature, etc.
Labelling: Texts or labels can be automatically added to the view according to the values each element has in a particular field in its table of attributes.
The options shown in the symbols menu vary according to the type of layer (point, line or polygon layer).
The options available for a polygon layer, which has the most configuration tools, are shown below.
A legend can be saved or loaded (recovered) at any time.
Símbolo único
The following symbol configuration options are available:
Fill: Allows the fill colour to be selected.
Fill type: Allows the fill pattern to be selected.
Line: Allows the line colour to be selected.
Line style: Allows the style of the line to be selected.
Synchronising line and fill colours.
Line width: Allows the width of the line to be defined.
Transparency: Gives the elements a degree of transparency so that polygon layers can be superimposed and yet still viewed.
In point-type shape layers you can use the “Unique symbol” option in the “Symbols” tab to define the symbol type, the colour and point size you wish this layer to be displayed with.
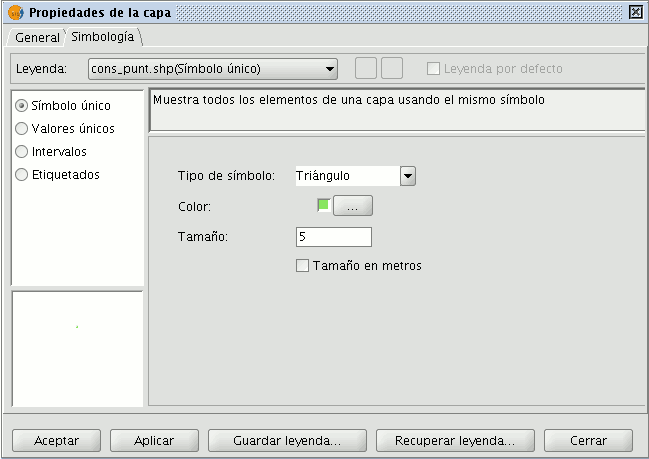
· Click on the “Symbol type” pull-down menu and select the symbol you wish the layer to be displayed with. Select the colour and set the size of the symbol you have chosen.
Click on “Apply” to see a preview of the set configuration.
Click on “Ok” if you wish to make this configuration permanent.
Click on the “Symbol type” pull-down menu and select the symbol you wish the layer to be displayed with. Select the colour and set the size of the symbol you have chosen.
Click on “Apply” to see a preview of the set configuration.
Click on “Ok” if you wish to make this configuration permanent.
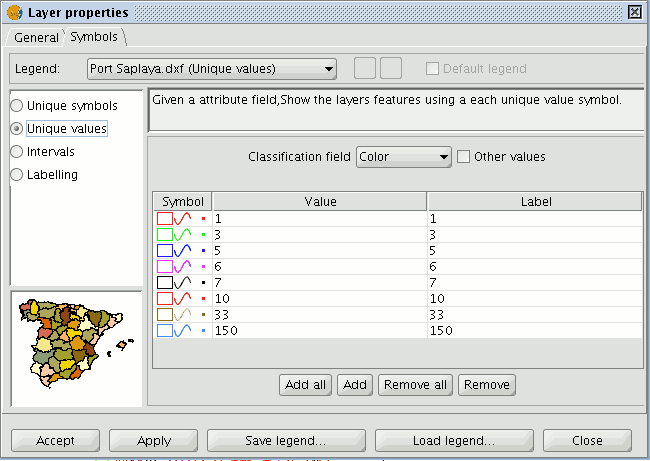
Valores únicos
The following symbol configuration options are available:
Classification field: A pull-down menu appears in which you can select the layer’s table of attributes’ field which contains the data to be sorted.
Add all/Add: Once you have selected the “Classification field”, click on the “Add all” button to see all the different values. These values have all been assigned a different symbol (colour). Click on these symbols to modify them. By default, the label (the name which appears in the legend) is similar to the value it has in the field. You can include new values to the list by pressing the “Add” button.
Remove all/Remove: This allows all (Remove all) or some (Remove) of the elements in the legend to be removed.
Labels: Left click on any of the “Label” “cells” to modify the name they will have in the legend.
Intervalos
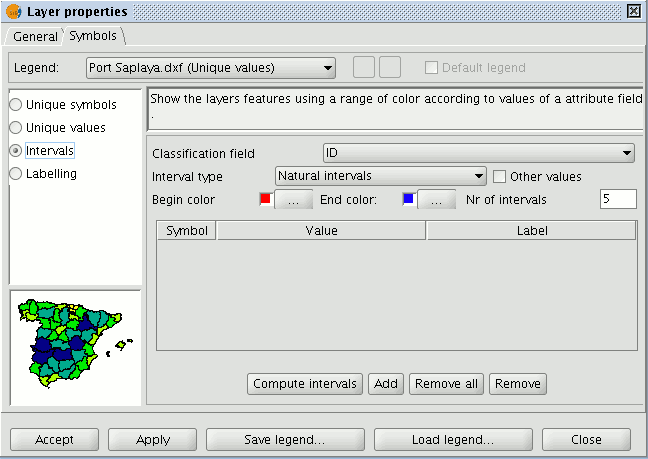
Classification field: A pull-down menu appears in which you can select the layer’s table of attributes’ field, which contains the data to be sorted. The field must be numerical because this is a gradual classification (by ranges of values).
Number of Intervals: This must indicate the number of ranges or intervals that define its classification.
Start colour and End colour: Select the colours to be graduated. The start colour is for the lowest values and the end colour is for the highest values.
Computing intervals: When you have defined the previous options, click on the “Compute intervals” button to see the legend’s end result. The symbols and the labels which appear by default can be modified by clicking on them, as in the previous cases.
Add: New ranges can be added to the computed intervals.
Remove all / Remove: This allows all (Remove all) or some (Remove) of the elements in the legend to be removed.
- Type of intervals: From gvSIG version 0.4 onwards, you can specify the interval type you wish to divide the information into in order to represent it. You can choose between the following options:
- Equal intervals: The number of intervals are specified and the sample is divided into this number of equal intervals.
- Natural intervals: The number of intervals is specified and the sample is divided into this number of intervals according to the Jenk method of optimising the natural breaks for the intervals.
- Quantile intervals: The number of intervals is specified and the sample is divided into this number of intervals but the values are grouped together according to their order number.
Etiquetado
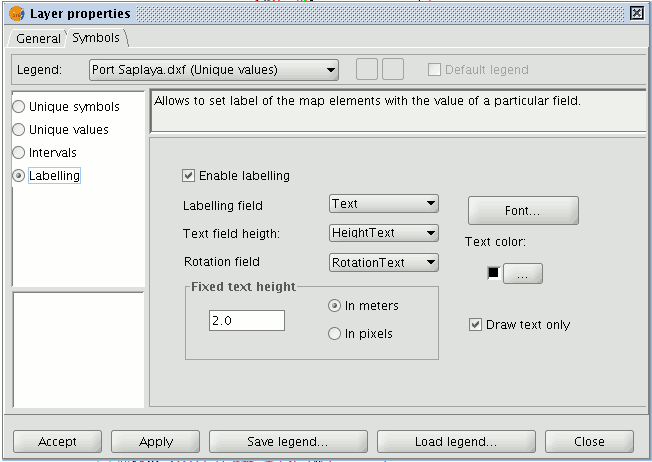
Enable labelling: Activate the check box to make the labelling visible in the view.
Labelling field: This is a pull-down menu which allows you to choose the layer’s table of attributes’ field, which contains the values to be shown as labels.
Text height field: This allows you to choose the layer’s table of attributes field which contains the values to be used for the label height.
Text rotation field: This allows you to choose the table of attributes field which indicates the label rotation angle.
Text colour: Allows the text colour to be selected.
Font: Allows the type of font to be selected.
Constant text height: Select the units (metres or pixels) and the text size. If you select “pixels”, the apparent text size will remain constant, even if you change the viewing scale; if you select “metres”, the text height on the display will vary according to the scale you are working in but will remain constant in geographic units.


